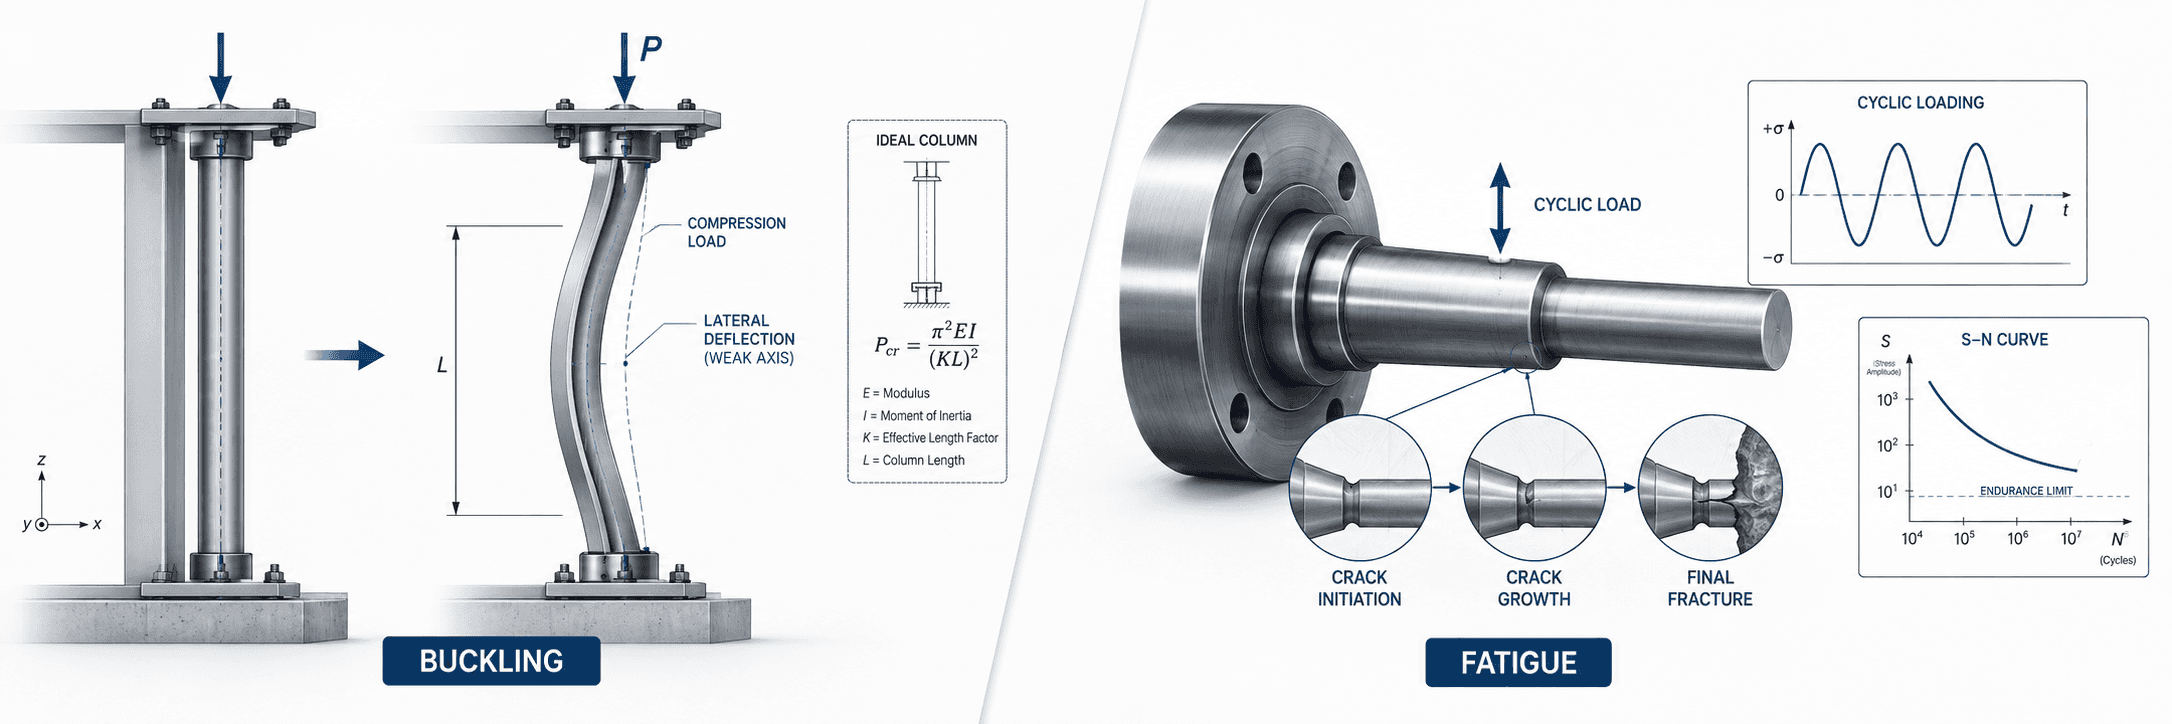
Buckling and Fatigue
Buckling and Fatigue
Understanding Failure Before Material Strength Is Exhausted
A mechanical component does not always fail because its stress exceeds the tensile strength of the material.
A slender column may suddenly bend sideways while the compressive stress is still below the yield strength.
A rotating shaft may fracture after millions of cycles even though the maximum stress has never exceeded the material's static yield strength.
These two phenomena are known as buckling and fatigue.
They are fundamentally different from simple static strength problems.
Buckling is primarily a stability problem.
Fatigue is primarily a cyclic damage problem.
Both demonstrate an important principle of machine design:
A component can fail even when conventional static stress calculations appear acceptable.
Therefore, mechanical design cannot stop at:
Applied Stress < Yield Strength
A more complete evaluation must ask:
Is the structure stable under compression, and can the material survive the required number of load cycles?
1. What Is Buckling?
Buckling is a structural instability that occurs mainly in members subjected to compression.
Consider a straight slender column carrying an axial compressive force.
At relatively low loads, the column remains nearly straight.
As the load increases, a critical condition is reached.
Beyond this point, a very small lateral disturbance can cause the column to deflect rapidly sideways.
This critical load is called the buckling load.
The important point is that buckling may occur before the material reaches its yield strength.
Therefore:
Material Strength alone does not determine compressive structural capacity.
Buckling depends strongly on:
Member length
Cross-sectional geometry
Elastic modulus
End restraint
Initial imperfections
Load eccentricity
2. Compression Failure and Buckling Are Different
A short, thick member under compression may fail primarily by material yielding.
A long, slender member may fail primarily by buckling.
The distinction is important.
For a short compression member:
Failure is controlled mainly by material strength.
For a slender compression member:
Failure may be controlled mainly by structural stability.
Two members made from the same material and having the same cross-sectional area can therefore have completely different compressive capacities if their lengths and section shapes are different.
This leads to a fundamental relationship:
Compression Capacity = Material + Geometry + Length + Boundary Conditions
3. Euler Buckling
For an ideal, slender, perfectly straight elastic column, the classical critical buckling load is given by Euler's equation:
Pcr = π²EI / (KL)²
where:
Pcr = Critical buckling load
E = Young's modulus
I = Second moment of area
L = Actual column length
K = Effective length factor
The quantity:
Le = KL
is called the effective length.
Euler's equation shows several important design relationships.
The critical buckling load increases with:
Young's modulus E
Second moment of area I
and decreases strongly with:
Effective length squared
Therefore:
Pcr ∝ 1 / L²
A relatively small increase in unsupported length can dramatically reduce buckling capacity.
4. Effective Length and Boundary Conditions
A column's physical length is not enough to determine buckling behavior.
The way its ends are restrained is equally important.
Typical idealized conditions include:
Pinned–Pinned
Fixed–Free
Fixed–Pinned
Fixed–Fixed
These conditions are represented through the effective length factor K.
Typical theoretical values are approximately:
Pinned–Pinned:
K = 1.0
Fixed–Free:
K = 2.0
Fixed–Pinned:
K ≈ 0.7
Fixed–Fixed:
K = 0.5
Because buckling load depends on:
1 / (KL)²
the support condition can change the theoretical buckling capacity by several times.
This makes boundary conditions especially important in structural analysis.
A model that assumes unrealistic restraint can significantly overestimate buckling strength.
5. Second Moment of Area and Buckling
Euler buckling depends on the second moment of area:
I
not simply on cross-sectional area.
This distinction is fundamental.
A solid bar and a thin-walled section may contain similar amounts of material, but their buckling resistance can differ greatly depending on how that material is distributed around the neutral axis.
Moving material farther away from the centroid generally increases I.
Therefore geometric efficiency becomes very important.
This is why structural members often use shapes such as:
Tubes
Box sections
I-sections
Channels
Reinforced plate structures
rather than simple solid rectangular bars.
In buckling design:
Where the material is located may be more important than how much material is present.
6. Buckling Occurs About the Weak Axis
A column may have different second moments of area about different axes.
For example:
Ix ≠ Iy
The column will generally tend to buckle about the axis with the smaller flexural stiffness:
EImin
Therefore the critical buckling direction is usually associated with:
Imin
A machine frame member that appears strong in one viewing direction may be very weak in another.
This is particularly important for:
Flat bars
Rectangular tubes
Channels
Angles
Sheet-metal structures
Asymmetric profiles
Buckling analysis must therefore consider all relevant directions.
7. Radius of Gyration
The relationship between cross-sectional area and second moment of area can be expressed using the radius of gyration:
r = √(I / A)
where:
r = Radius of gyration
I = Second moment of area
A = Cross-sectional area
The radius of gyration describes how effectively the cross-sectional area is distributed away from the centroid.
A larger r generally means greater resistance to column buckling for the same area.
This quantity becomes important when defining slenderness.
8. Slenderness Ratio
A commonly used measure of column slenderness is:
λ = KL / r
where:
λ = Slenderness ratio
K = Effective length factor
L = Actual length
r = Radius of gyration
A large slenderness ratio generally indicates that elastic buckling is likely to dominate.
A small slenderness ratio generally indicates that material yielding or inelastic behavior may become more important.
Therefore buckling cannot be understood only through stress.
The proportion of the structure is itself a design variable.
9. Euler Buckling Stress
Euler's equation can also be expressed as a critical stress.
Using:
r² = I / A
the Euler buckling stress becomes:
σcr = π²E / λ²
This relationship clearly shows that the critical stress decreases rapidly as slenderness increases.
Therefore a very slender column may buckle at a compressive stress far below the material yield strength.
This explains why increasing material strength alone may provide little benefit for very slender structures.
For such structures, changing:
Geometry
Effective length
Bracing
Support conditions
may be much more effective.
10. Elastic and Inelastic Buckling
Euler's equation assumes that the column remains within the linear elastic range.
However, not all compression members satisfy this condition.
For intermediate slenderness ratios, local material yielding may begin before classical Euler buckling occurs.
This region is often described as inelastic buckling.
Therefore column behavior can conceptually be divided into:
Short Column
→ Material yielding dominates
Intermediate Column
→ Inelastic buckling interaction
Long Slender Column
→ Elastic Euler buckling dominates
This means Euler's equation should not be applied blindly to every compression member.
11. Real Columns Are Not Perfect
Euler buckling theory assumes an ideal column that is:
Perfectly straight
Perfectly centered under load
Uniform in material
Uniform in geometry
Free from residual stress
Real machine structures do not satisfy these assumptions.
They contain:
Initial curvature
Manufacturing tolerances
Welding distortion
Load eccentricity
Residual stress
Misalignment
Local geometric imperfections
These imperfections can significantly reduce the practical buckling capacity.
Therefore real buckling strength is usually lower than the theoretical ideal value.
12. Load Eccentricity
A compressive load rarely acts exactly through the centroid of a real component.
If the load is offset by an eccentricity e:
M = Pe
A nominal axial compression problem therefore becomes a combined loading problem:
Compression + Bending
The resulting stress may be approximated conceptually as:
σ = P / A ± My / I
Even a small eccentricity can produce significant bending in a slender member.
This is one reason real structures may buckle at loads below the ideal Euler prediction.
13. Geometric Imperfection Sensitivity
Buckling is strongly sensitive to initial geometry.
A member that is initially slightly curved does not remain perfectly straight under compression.
Instead, compression amplifies the existing lateral deflection.
This creates a feedback mechanism:
Initial Deflection
→ Bending Moment
→ Additional Deflection
→ Larger Bending Moment
This is sometimes associated with second-order effects.
The structure may therefore become progressively more unstable as load increases.
14. P–Δ Effect
When a compressive force P acts through a laterally displaced member, an additional bending moment is created.
Conceptually:
Msecondary ≈ PΔ
where:
Δ = Lateral displacement
This is known as a P–Δ effect.
The important point is that deformation itself creates additional loading.
Therefore:
Load → Deformation → Additional Moment → More Deformation
This feedback distinguishes stability problems from simple linear stress calculations.
15. Local Buckling
Buckling does not occur only in entire columns.
Thin plates and thin-walled sections may experience local buckling.
Examples include:
Tube walls
Sheet-metal frames
Box structures
Channels
Machine covers carrying compression
Thin web plates
A structural member may therefore remain globally straight while one wall or plate buckles locally.
Local buckling depends strongly on:
Plate thickness
Plate width
Edge restraint
Material stiffness
Stress distribution
This becomes increasingly important as designers reduce thickness to save weight and cost.
16. Global and Local Buckling Can Interact
A thin-walled member may experience multiple instability modes.
For example:
Local Plate Buckling
may reduce section stiffness.
That reduction may then decrease:
Global Column Buckling Capacity
Therefore local and global instability are not always independent.
Complex machine frames, welded structures, and thin-wall assemblies may require more detailed analysis than a simple Euler calculation.
17. Bracing and Buckling Resistance
One of the most effective ways to improve buckling resistance is to reduce unsupported length.
From Euler's relation:
Pcr ∝ 1 / L²
If the effective length is reduced by half, the theoretical Euler buckling load increases by approximately four times.
This makes bracing extremely efficient.
Possible design measures include:
Cross braces
Intermediate supports
Guide points
Ribs
Gussets
Frame triangulation
Therefore buckling problems should not automatically be solved by increasing material thickness.
Changing the structural topology may be much more effective.
18. Buckling in Machine Design
Buckling can occur in many machine elements, including:
Pneumatic cylinder rods
Hydraulic cylinder rods
Long push rods
Lead screws
Vertical columns
Machine legs
Frame members
Thin sheet structures
Robot links
Compression springs
For cylinder rods, for example, the required diameter may be governed not by compressive stress but by buckling.
This becomes particularly important when:
Stroke is long
Rod extension is large
Load is compressive
End support is flexible
19. What Is Fatigue?
Fatigue is progressive damage caused by repeated or fluctuating loading.
A component may survive a single application of a given load but fail after that same load is repeated many times.
The fatigue process generally involves:
Crack Initiation
→ Crack Propagation
→ Final Fracture
The final fracture may occur suddenly even though the preceding damage accumulated gradually over a long period.
20. Fatigue Can Occur Below Yield Strength
One of the most important characteristics of fatigue is that failure may occur while the maximum stress remains below the static yield strength.
Therefore:
σmax < Yield Strength
does not guarantee fatigue safety.
A rotating shaft may experience millions of bending cycles.
A welded bracket may repeatedly vibrate.
A blade holder may experience repeated cutting impact.
A spring may cycle continuously.
In each case, small amounts of damage can accumulate until a crack forms.
21. Cyclic Stress
A time-varying stress may be described by:
σmax
and
σmin
From these values, the mean stress is:
σm = (σmax + σmin) / 2
The stress amplitude is:
σa = (σmax − σmin) / 2
and the stress range is:
Δσ = σmax − σmin
These quantities are fundamental in fatigue analysis.
Fatigue behavior depends not only on the maximum stress but also on how the stress varies with time.
22. Stress Ratio
The stress ratio is commonly defined as:
R = σmin / σmax
Examples include:
Fully reversed loading:
R = −1
Repeated tension from zero:
R = 0
Constant tensile stress:
R = 1
Different stress ratios can produce different fatigue lives even when the maximum stress is the same.
Mean stress therefore becomes an important part of fatigue evaluation.
23. S–N Curve
High-cycle fatigue behavior is commonly represented using an S–N curve.
S represents stress amplitude.
N represents the number of cycles to failure.
The general trend is:
Higher Stress → Shorter Life
Lower Stress → Longer Life
The S–N curve is usually obtained experimentally.
Therefore fatigue data are inherently more statistical than simple elastic material properties such as Young's modulus.
24. High-Cycle and Low-Cycle Fatigue
Fatigue is commonly divided conceptually into:
High-Cycle Fatigue
Large number of cycles.
Deformation is primarily elastic.
Stress-based methods are commonly used.
Low-Cycle Fatigue
Lower number of cycles.
Significant plastic strain may occur.
Strain-based methods are often more appropriate.
The distinction matters because the governing material behavior changes.
25. Endurance Limit
Some steels may exhibit a practical fatigue endurance region under certain test conditions.
Below a sufficiently low stress amplitude, fatigue life can become very long.
This is often described using an endurance limit.
However, this concept should not be applied universally.
Many materials, including aluminum alloys, do not exhibit a clear endurance limit in the same way.
Their fatigue strength is usually specified at a particular number of cycles.
Therefore:
Endurance Limit is material- and condition-dependent.
26. Laboratory Fatigue Strength Is Not Machine Fatigue Strength
Fatigue data are often obtained from carefully prepared laboratory specimens.
Real machine components are different.
Their fatigue strength may be affected by:
Surface finish
Size
Temperature
Reliability requirement
Manufacturing process
Corrosion
Stress concentration
Residual stress
Loading type
Therefore laboratory fatigue strength generally must be modified before being applied directly to a real machine component.
27. Surface Condition
Fatigue cracks often initiate at the surface.
Therefore surface condition has a strong influence on fatigue performance.
A rough machined surface contains microscopic irregularities that act as local stress raisers.
Polished surfaces generally perform better than rough surfaces under otherwise similar conditions.
Important factors include:
Machining marks
Grinding marks
Scratches
Corrosion pits
Surface defects
For fatigue-sensitive components, surface quality is a structural design variable, not merely a cosmetic requirement.
28. Stress Concentration and Fatigue
Geometric discontinuities create stress concentration.
Examples include:
Keyways
Threads
Grooves
Holes
Sharp shoulders
Snap-ring grooves
Weld toes
For static loading, the theoretical stress concentration factor may be represented by:
Kt
However, fatigue sensitivity is often expressed through a fatigue stress concentration factor:
Kf
Kf is generally related to Kt but also depends on the material's notch sensitivity.
Therefore:
Geometric Stress Concentration + Material Notch Sensitivity → Fatigue Effect
29. Notch Sensitivity
Not all materials respond equally to a geometric notch.
The fatigue stress concentration factor may be represented conceptually as:
Kf = 1 + q(Kt − 1)
where:
q = Notch sensitivity
If:
q = 0
the material is relatively insensitive to the notch.
If:
q = 1
the full theoretical stress concentration strongly influences fatigue behavior.
This is an example of how:
Geometry + Material Behavior
combine to determine fatigue performance.
30. Mean Stress Effect
Fatigue life is strongly influenced by mean stress.
A tensile mean stress generally reduces fatigue strength.
A compressive mean stress can often improve fatigue resistance.
Several engineering relationships are used to account for this effect.
Common approaches include:
Goodman
Gerber
Soderberg
The Goodman relation is often expressed conceptually as:
σa / Se + σm / Sut ≤ 1
where:
Se = Fatigue strength or endurance limit
Sut = Ultimate tensile strength
The Soderberg relation uses yield strength instead of ultimate tensile strength and is generally more conservative.
31. Residual Stress and Fatigue
Residual stress can significantly influence fatigue life.
Tensile residual stress near the surface may accelerate crack initiation.
Compressive residual stress near the surface may improve fatigue resistance.
Processes such as shot peening intentionally introduce compressive surface residual stress.
Therefore manufacturing can alter fatigue life even when the nominal geometry remains unchanged.
This creates an important relationship:
Manufacturing Process → Residual Stress → Fatigue Performance
32. Size Effect
Larger components often exhibit lower fatigue strength than small laboratory specimens.
One reason is that a larger highly stressed volume contains a greater probability of defects.
The stress distribution and surface area also change.
Therefore component scale must be considered when converting test data into practical design values.
33. Corrosion Fatigue
A cyclically loaded component exposed to a corrosive environment may experience corrosion fatigue.
Corrosion pits can act as crack initiation sites.
The interaction may be severe:
Corrosion
→ Surface Defect
→ Stress Concentration
→ Crack Initiation
→ Fatigue Growth
This is especially important in:
Food machinery
Marine equipment
Chemical machinery
Outdoor structures
Washdown environments
Material selection and surface protection therefore influence structural life.
34. Welded Structures and Fatigue
Welded structures require special attention in fatigue design.
Welded joints naturally contain:
Geometric discontinuities
Weld toe stress concentration
Residual stress
Possible defects
Local distortion
Therefore fatigue performance of welded structures cannot usually be evaluated using only the base material fatigue strength.
The weld detail itself becomes the fatigue-critical feature.
This is particularly relevant to:
Machine frames
Stainless welded structures
Support brackets
Sheet-metal assemblies
35. Crack Initiation
Fatigue cracks commonly initiate at locations where local cyclic stress is high.
Typical locations include:
Sharp fillets
Thread roots
Keyway corners
Surface scratches
Weld toes
Corrosion pits
Material inclusions
Therefore fatigue design begins long before crack mechanics.
It begins with geometry and manufacturing quality.
36. Crack Propagation
Once a fatigue crack has formed, repeated loading can cause the crack to grow incrementally.
The crack creates its own stress concentration.
As the crack becomes larger, the local stress intensity increases.
Therefore crack growth can accelerate over time.
This creates the sequence:
Small Crack
→ Higher Local Stress Intensity
→ Crack Growth
→ Larger Crack
→ Further Growth
37. Paris Law
For a certain region of stable fatigue crack growth, the crack growth rate is often approximated by Paris law:
da/dN = C(ΔK)^m
where:
a = Crack length
N = Number of cycles
ΔK = Stress intensity factor range
C, m = Material constants
This equation belongs to fracture mechanics rather than conventional S–N fatigue design.
It becomes useful when a crack is already assumed to exist.
38. Fatigue Damage Accumulation
Real machines often experience variable-amplitude loading.
A machine may operate under:
Light load
Normal load
Peak load
Acceleration
Shock
during different parts of its duty cycle.
A common simplified damage model is Miner's rule:
D = Σ(ni / Ni)
where:
ni = Applied cycles at stress level i
Ni = Cycles to failure at that stress level
Failure is often approximated when:
D ≈ 1
Miner's rule is simple and widely used, but it does not capture every sequence or interaction effect.
39. Fatigue and Load Spectrum
For practical machine design, a single maximum load may not be sufficient.
The designer may need to define a load spectrum.
For example:
10% of operation at high load
60% at normal load
30% at low load
This allows fatigue damage to be evaluated over the actual operating duty cycle.
Therefore operating history becomes part of structural design.
40. Rotating Shaft Fatigue
A rotating shaft is a classic fatigue example.
Suppose a constant transverse force produces bending.
Although the external force is constant in space, a point on the rotating shaft surface moves continuously between:
Tension
and
Compression
As the shaft rotates:
Tension → Zero → Compression → Zero → Tension
This creates fully reversed cyclic bending stress.
Therefore a seemingly static external load can create a fatigue load inside a rotating component.
41. Fatigue Is a Local Problem
Just as stress is local, fatigue is also strongly local.
A global average stress may appear safe while a small geometric detail experiences severe cyclic stress.
Therefore fatigue design should focus on:
Critical locations
Local stress concentration
Surface condition
Material behavior
Actual load history
not simply the average stress of the entire part.
42. Buckling and Fatigue Are Different Failure Mechanisms
Buckling and fatigue should not be confused.
Buckling is primarily controlled by:
Compression + Geometry + Stiffness + Stability
Fatigue is primarily controlled by:
Cyclic Stress + Local Detail + Material + Number of Cycles
Buckling may occur almost instantaneously when a critical load is exceeded.
Fatigue may develop gradually over thousands or millions of cycles.
One is mainly a stability phenomenon.
The other is mainly a damage accumulation phenomenon.
43. But Buckling and Fatigue Can Interact
In real machines, failure modes are not always independent.
Repeated compression may create cyclic bending in a slender member.
Small geometric deformation may change alignment.
Misalignment may increase bending stress.
The increased stress may accelerate fatigue damage.
A conceptual interaction may therefore be:
Initial Imperfection
→ Buckling Deflection
→ Additional Bending Stress
→ Cyclic Stress Increase
→ Fatigue Damage
This is why complex machine structures should be evaluated as systems rather than isolated formulas.
44. Buckling in Finite Element Analysis
Linear eigenvalue buckling analysis is commonly used to estimate possible buckling modes and theoretical load multipliers.
However, linear buckling analysis typically assumes:
Perfect geometry
Linear material behavior
Idealized loading
Therefore it may significantly overestimate real buckling capacity.
For more realistic analysis, nonlinear approaches may include:
Initial geometric imperfection
Material nonlinearity
Large deformation
Contact effects
Real boundary conditions
The calculated eigenvalue should therefore not automatically be interpreted as the actual physical collapse load.
45. Fatigue in Finite Element Analysis
FEA can provide the local stress history required for fatigue evaluation.
A typical workflow may be:
Geometry
→ Load Cases
→ Stress Field
→ Critical Stress History
→ Fatigue Model
→ Estimated Life
However, fatigue prediction requires more information than a static stress contour.
It may require:
S–N data
Mean stress correction
Surface factor
Size factor
Notch effect
Load spectrum
Material condition
Therefore:
Static FEA Result ≠ Fatigue Life
The fatigue model must interpret the stress history.
46. Buckling Design Process
A practical buckling evaluation can follow this sequence.
1. Identify compression members
Determine which components carry significant compressive load.
2. Determine effective unsupported length
Include actual restraint and guide conditions.
3. Determine weak-axis properties
Calculate:
Imin
and:
rmin
4. Calculate slenderness
λ = KL / r
5. Determine applicable buckling regime
Check whether elastic Euler buckling is appropriate or whether inelastic behavior must be considered.
6. Include eccentricity and imperfections
Avoid assuming perfectly centered loads.
7. Check local buckling
Evaluate thin plates and walls.
8. Evaluate deflection amplification
Consider second-order effects if relevant.
9. Apply appropriate safety margin
Account for uncertainty in load, geometry, and restraint.
47. Fatigue Design Process
A practical fatigue analysis can follow this sequence.
1. Identify cyclic loads
Determine which loads vary with time.
2. Determine critical locations
Focus on:
Fillets
Threads
Holes
Keyways
Welds
Contact locations
3. Determine stress history
Calculate:
σmax, σmin, σa, σm
4. Determine fatigue properties
Obtain appropriate S–N or strain-life data.
5. Modify laboratory data for real component conditions
Consider:
Surface
Size
Reliability
Temperature
Environment
6. Include stress concentration
Use appropriate fatigue notch factors.
7. Correct for mean stress
Use an appropriate method such as Goodman where applicable.
8. Determine expected cycle life
Compare calculated stress state with fatigue data.
9. Evaluate variable-amplitude damage
Use load spectrum and cumulative damage methods when necessary.
10. Review manufacturing and inspection
Fatigue performance depends strongly on local detail quality.
48. The Design Meaning of Buckling
Buckling teaches an important design lesson.
A component's load capacity is not determined only by:
Material Strength
It may instead be governed by:
Geometry + Length + Restraint + Imperfection
For slender structures, increasing yield strength may do little if the actual problem is instability.
The correct solution may instead be:
Shorten the unsupported length
Increase section depth
Add bracing
Improve restraint
Change structural topology
Buckling is therefore a clear example of why geometry can dominate material strength.
49. The Design Meaning of Fatigue
Fatigue teaches a different lesson.
A structure does not only remember the load it carries now.
It is affected by the history of loading.
A stress that is completely safe once may become destructive after millions of repetitions.
Therefore fatigue introduces time into structural design.
The relevant question changes from:
“Can this component carry this load?”
to:
“How many times can this component carry this load?”
This is a fundamental shift in design thinking.
Understanding Buckling and Fatigue Means Understanding Failure Beyond Static Strength
Static stress analysis asks whether the material can resist the current load.
Buckling asks whether the structure can remain geometrically stable under that load.
Fatigue asks whether the material can survive repeated exposure to that load.
The three questions are different:
Static Strength
→ Can the material resist the load?
Buckling
→ Can the structure maintain stability?
Fatigue
→ Can the structure survive the required number of cycles?
Therefore a more complete structural design chain is:
Load
→ Geometry
→ Stress
→ Deformation
→ Stability
→ Cyclic Damage
→ Service Life
→ Functional Acceptability
The important engineering question is not simply:
“Is the calculated stress below the yield strength?”
A more complete question is:
“Will the structure remain stable under compression, will repeated loading initiate and propagate damage, and will the component continue to maintain its required function throughout its intended service life?”
That distinction is essential in practical machine design.
Buckling tells us whether a structure can preserve its geometric stability. Fatigue tells us whether it can preserve its structural integrity over time. Together, they explain why safe static stress alone is never a complete definition of mechanical reliability.